
Examples for the Waterfall 3D Chart can be found in the SciChart WPF Examples Suite which can be downloaded from the SciChart Website or our SciChart.WPF.Examples Github Repository.
The Waterfall 3D Chart renders a two-dimensional array as a series of slices. The WaterfallRenderableSeries3D type provides a number of configurable chart types in SciChart 3D, including:
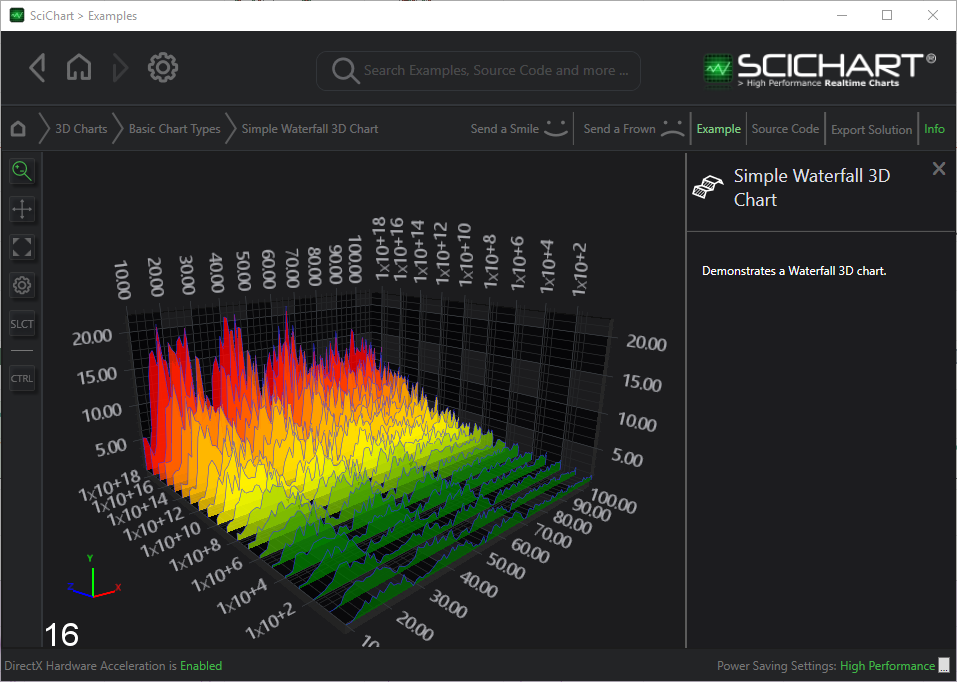
- Dynamic updating slices for visualizing spectra (Acoustic or radio frequency domain data)
- Volumetric slices
- Optional PointMarkers at data-points.
Declaring a Waterfall 3D Chart
To declare a Waterfall 3D Chart with SciChart, use the following code:
Data is stored in the WaterfallDataSeries3D Type. This represents a 2-dimensional array of arrays (or 2D Jagged array) typically of type Double (but can be defined with generics). It also accepts an array of spacings to define where the slices exist in the Z-direction (see slicePositions above).
Some important points to note:
- The double values stored in the WaterfallDataSeries3D correspond to the heights on the chart (the Y-Axis). They are transformed into chart World Coordinates via the SciChart3DSurface.YAxis.
- The X Data-Value is defined by the StartX, StepX properties on WaterfallDataSeries3D. These are also transformed into World Coordinates via the SciChart3DSurface.ZAxis and XAxis respectively.
- The Z position of slices is defined by the slipdePositions array passed to the constructor of WaterfallDataSeries3D.
- The Color of each slice on the WaterfallRenderableSeries3D are defined by the ZColorMapping property, which accepts a GradientColorPalette or SolidColorBrushPalette. You can also apply colors in the Y direction with the YColorMapping property.
- The Color of each outline or stroke on the WaterfallRenderableSeries3D are defined by the ZStrokeColorMapping and YStrokeColorMapping properties.